The SGI provide the most comprehensive survey of sustainable governance in OECD and EU countries. Advocating the exchange of good practices, we offer full access to our data set and enable comparisons that generate future innovations in governance.
ABOUT THE SGI
To achieve this, the project developed a comprehensive monitoring instrument to evaluate the sustainability of policymaking and the quality of democratic governance in the areas of economic, social and environmental policy across 30 OECD and EU countries.
SGI DATA
Survey Structure
Explore the SGI’s three dimensions to dive straight into the underlying components. Select your area of interest to discover how countries are performing.
Democratic Government
Governing with Foresight
Sustainable Policymaking
Democratic Government
Ranking
Governing with Foresight
Ranking
Sustainable Policymaking
Ranking
SGI PUBLICATIONS
SGI Studies
Our studies offer comprehensive examinations of key aspects and region-specific challenges in sustainable governance. Our deep dives identify promising governance innovations that are essential for successful transformation
SGI Policy Briefs
Our policy briefs examine specific policy challenges, providing summaries of current interventions and good practices for policymakers, while considering their key impacts.
SGI Country Reports
Our country reports examine developments across all 64 indicators, providing detailed explanations for the numerical assessments in our key focus areas: sustainable policymaking, foresight in governance, and democratic governance.
SGI COUNTRIES
The SGI examines 30 member states of the Organization of Economic Cooperation and Development (OECD) and the European Union (EU), focusing on their performance in democratic governance, foresight- driven leadership and sustainable policymaking.
SGI ANALYSIS
Our new Analysis section allows you correlate individual results. You can plot each dimension, category, criterion and indicator on the horizontal (X) and vertical (Y) axes.
Higher scores are represented further to the right and top.
Trendline
Trendlines can be added to the graph, making it easier to spot significant correlations between selected variables.
Z-Axis
Add a third indicator to your analysis.
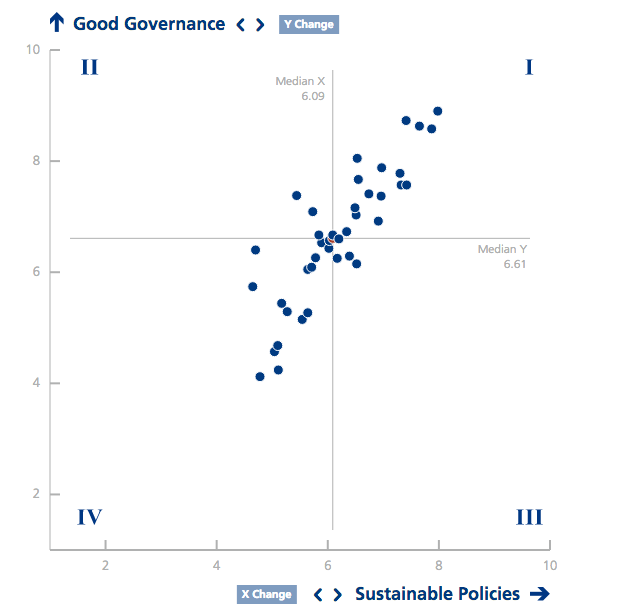
Quadrants
Two medians divide the
graph into four
quadrant groups:
Above-median perfor-
mances on both axes.
Below-median perfor-
mance on the X-axis,
above-median on the
Y-axis.
Above-median perfor-
mance on the X-axis,
below-median on the
Y-axis.
Below-median perfor-
mance on both axes.


